
Fatima Bouhaouche
UI/UX & Product Designer
 Case Study, 2026
Debull Ai
An AI-powered trading dashboard that transforms complex market data into clear insights through an intuitive, data-focused interface.
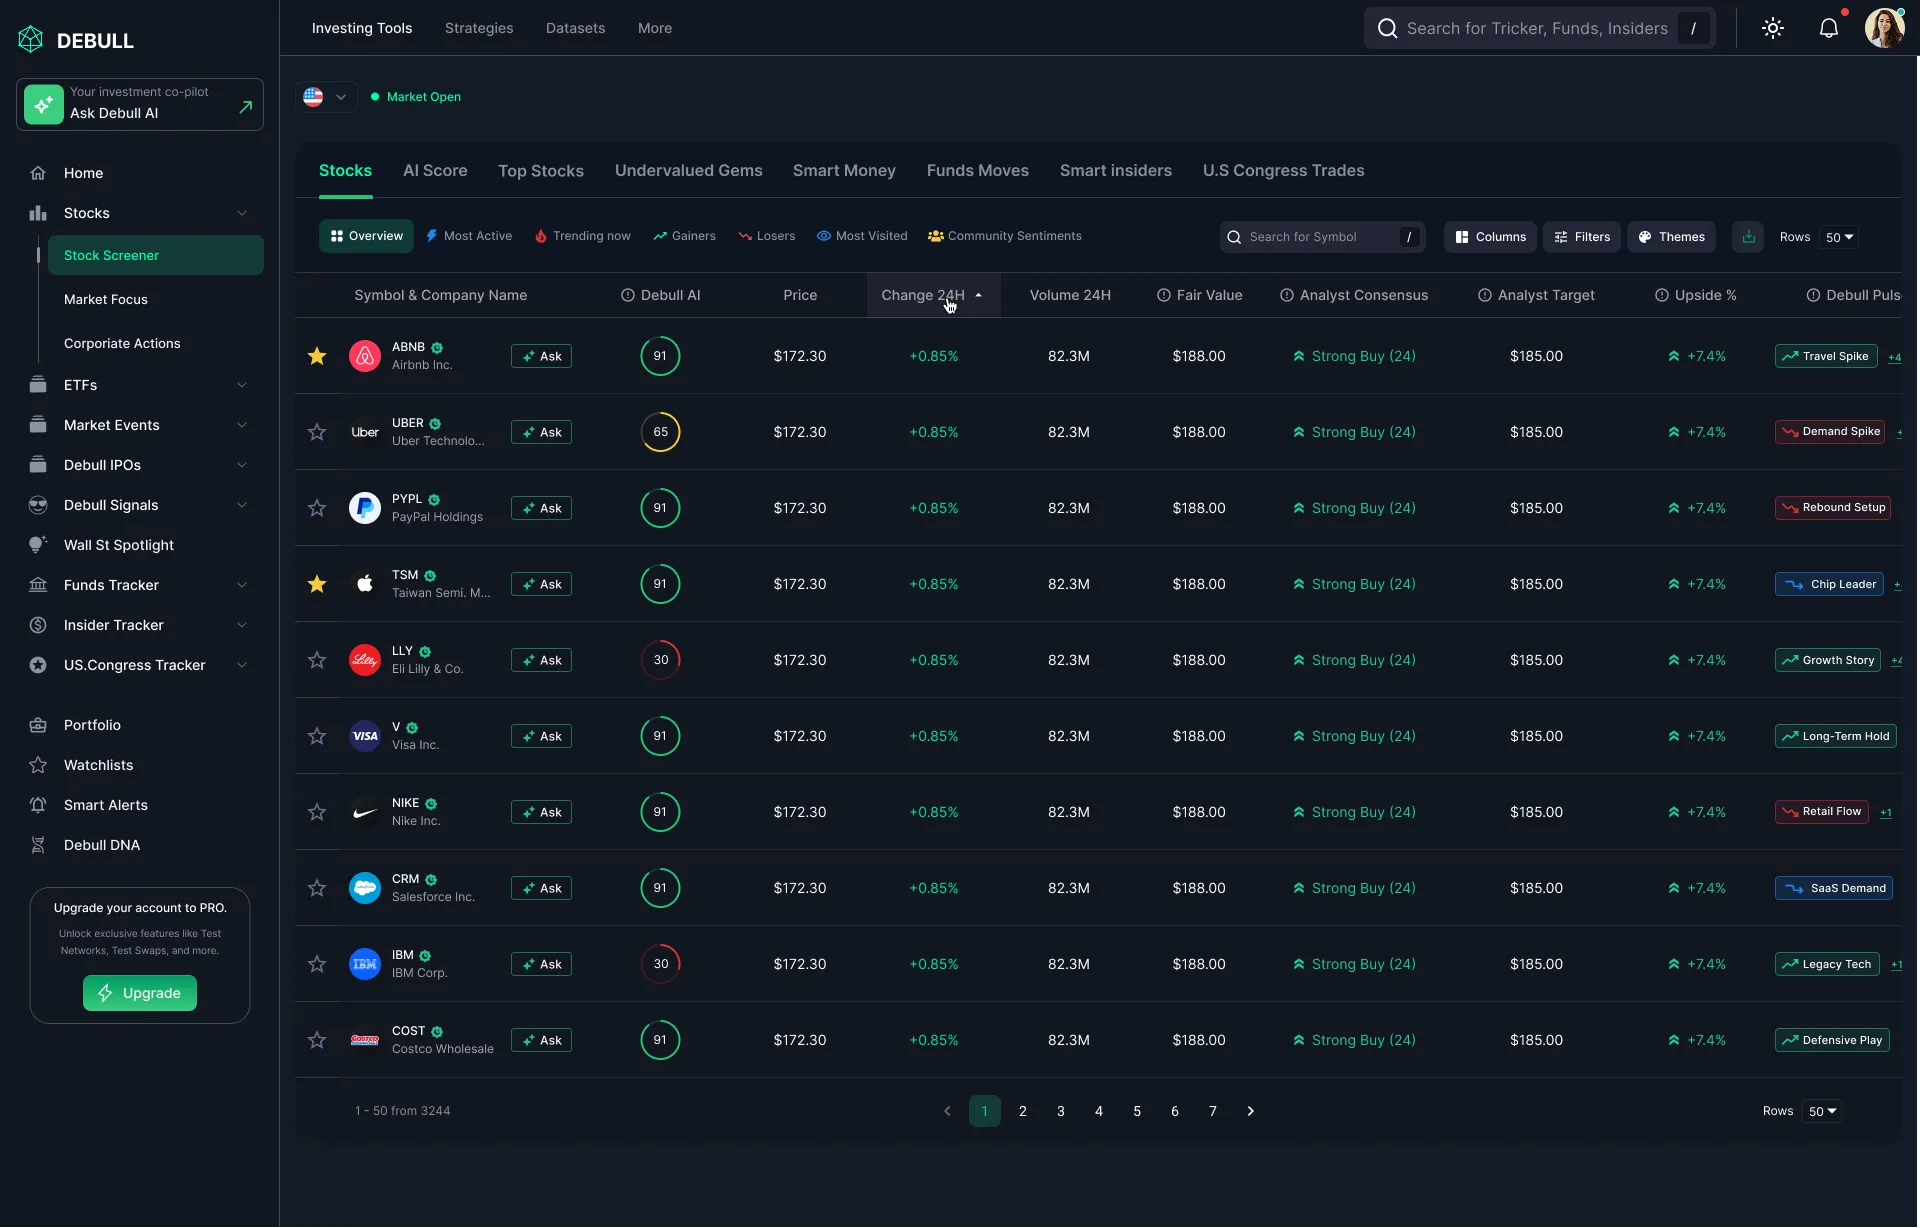
Overview
Debull Ai turns raw market feeds into AI-generated trade signals for retail and semi-pro traders. This wasn't a single screen, it's a full SaaS product spanning 12 dashboard modules, three distinct user roles sharing one account, and a token-based component system built to support 40+ chart and table variations without falling apart. My role was to design and systemize the core dashboard where traders spend most of their session, replacing a cluttered MVP with something built for fast, confident decisions at scale.
The Problem
The original dashboard piped in every available data point at once, charts, order books, sentiment scores, alerts, with no visual hierarchy, and no distinction between what a Trader, an Analyst, and a Team Admin each actually needed to see. Every new feature request was solved by adding another widget to the same flat screen, so the product was accumulating complexity faster than the UI could absorb it. Traders lost seconds hunting for the signal that mattered, which is exactly the time you don't have in a fast-moving market.
Goals
-
Give traders a single glanceable view of the signals that matter most -
Make dense data visualizations legible in seconds, not minutes -
Serve three different roles, Trader, Analyst, Team Admin, from one shared dashboard shell instead of three separate products -
Build a token-based design system robust enough to support 40+ chart and table variations consistently -
Design real-time data states (live, loading, stale, empty, error) for every widget, not just the happy path -
Support a dark-mode-first UI built for long trading sessions -
Let users customize and save their own widget layouts
6 of 6
traders shadowed during live sessions ignored more than half the widgets on screen, relying only on 2-3 they'd memorized the position of.
~40%
of a trader's session time went to scrolling and hunting for a specific chart rather than actually reading one.
Most requested,
least trusted: AI confidence scores were the feature traders asked for most, but discounted because they couldn't see the reasoning behind them.
3 roles,
1 screen: Traders, Analysts, and Team Admins were all using the exact same flat dashboard, each scrolling past widgets meant for someone else's job.
How I got there :
Process
Discovery & Research
Shadowed 6 active traders during live sessions and interviewed 2 team admins to see which data points each role actually acted on versus ignored.
Information Architecture
Mapped all 12 product areas into a single sitemap, then grouped the core dashboard into three priority tiers, act now, watch, and background context, to drive the new visual hierarchy.
Wireframing
Sketched modular widget layouts and stress-tested density against real historical market data, across all three role views.
Design System Architecture
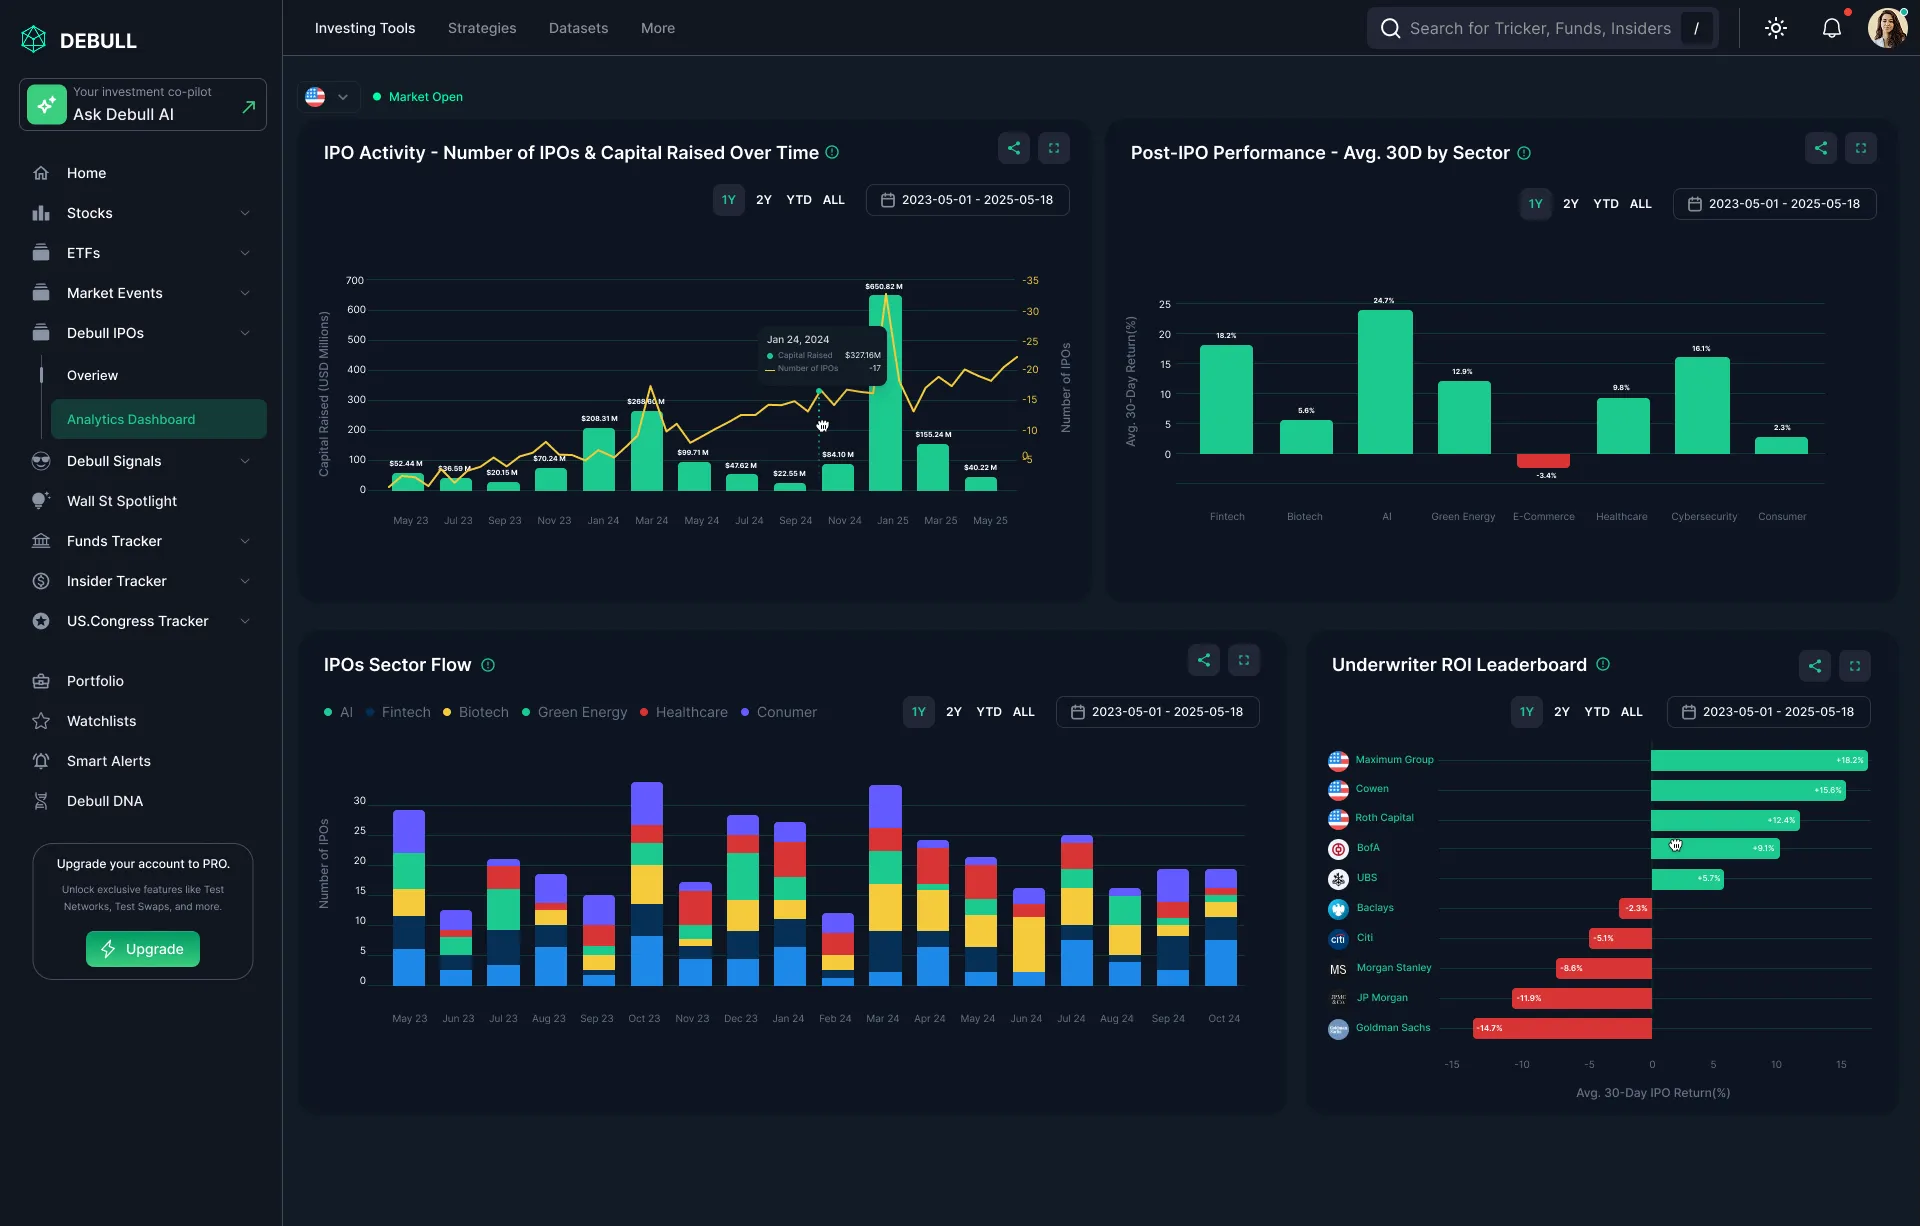
Built a token-based system, spacing, color, chart-state, and typography scales, so 40+ chart, table, and widget variants stayed visually consistent instead of drifting apart as new modules shipped.
Visual Design & Data Viz
Designed a dark-mode-first chart system with consistent color semantics for gains, losses, and AI confidence scores, including every widget's loading, empty, stale, and error state.
Prototyping & Testing
Built an interactive prototype and ran think-aloud sessions to time how fast traders could spot an actionable signal, and how quickly admins could locate role-management settings.
Handoff
Delivered a full component and chart-token library, documented per data state and per role, so engineering could ship new widgets without new design cycles.
Why I designed it this way :
Key UX Decisions
Decision 01
The dashboard treated every data point with equal visual weight, so traders couldn't tell what needed action right now versus what was background context.
Introduced a three-tier visual hierarchy, Act now / Watch / Context, using size, color saturation, and position rather than adding more UI chrome.
Traders in testing located the highest-priority signal in under 2 seconds, down from roughly 8.
Decision 02
Traders, Analysts, and Team Admins all needed the same underlying data, but each needed a different default view and different edit permissions on shared widgets, building three separate dashboards wasn't sustainable for a small engineering team.
Designed one flexible layout engine with role-based widget permissions and a default preset per role, instead of three standalone products sharing no code.
Each role now opens straight into the view relevant to their job, while engineering ships and maintains a single shared codebase.
Decision 03
AI confidence scores felt like a black box, so traders discounted them regardless of accuracy.
Paired every confidence score with a one-line 'why', e.g. 'based on 3 momentum indicators + volume spike', revealed on hover.
Increased trust in AI signals without touching the underlying model, a pure UX fix to an ML trust problem.
Decision 04
As the team shipped new widgets every sprint, spacing, chart colors, and empty/error states were quietly drifting inconsistent across modules, a common failure mode once a dashboard passes a certain size.
Replaced one-off styling with a token-based design system (spacing, color, chart-state, typography) so every new widget inherits the same rules by default instead of being redesigned from scratch.
New modules shipped in later sprints matched the system automatically, with no visual drift and no extra design review cycle needed.
Decision 05
The default light-mode dashboard caused eye strain during long trading sessions, per direct trader feedback.
Rebuilt the entire chart and color-token system dark-mode-first, then derived a light mode from it instead of the reverse.
Dark mode became the default for the large majority of users post-launch, validating it as the primary use case rather than an afterthought.
“We went from a dashboard our own team struggled to read to one traders actively customize and live in every day. Huge shift in perceived product quality.”

Contact Me
Set up a time to talk about your design needs.
Designed by Me